A coding agent is a loop. Ask one to fix a failing test and it reads a file, runs the test, reads the error, edits the file, runs the test again, and keeps going for thirty to sixty turns before it either finishes or gives up.
Every turn in that loop sends the model the whole conversation so far. Not the new part. All of it: the system prompt, the tool definitions, every file it has read, every command it has run, every diff it has applied. Turn forty carries everything from turns one through thirty-nine and adds a little.
Here is the plain version, before any of the architecture. The agent re-reads its entire notebook before it takes each step. What you want instead is for it to remember where it left off and read only the new page. Whether a serving engine can do that is called cross-request prefix caching, and on my hardware it was the difference between a turn costing twenty seconds and a turn costing a tenth of a second.
I chose an engine for this loop by measuring that. Tokens per second came third.
The box is two RTX 5090s, 64 GB of VRAM total, on a Ryzen 9950X. I wrote up how that machine is laid out and tuned and how I stopped its inference server burning two CPU cores at idle separately. This post is about which engine ended up running on it, and why the reason had almost nothing to do with speed.
vLLM vs SGLang: why the usual benchmark is the wrong benchmark
Search for a comparison of inference engines and you get charts of tokens per second and requests per second across batch sizes. Those charts are not wrong. They answer the question their authors have, which is how many concurrent users a GPU fleet can serve.
That is not my question.
A chat request is one-shot. Someone types, the server answers, the exchange is over. Throughput per GPU is exactly the right measure there, because the work is dominated by generating fresh tokens for many independent users.
An agent card is one user sending a long series of requests in which each one is nearly identical to the one before it. By turn thirty the unchanged shared prefix is most of the request, and the genuinely new content is a tool result plus a few hundred tokens of reasoning. The cost of that turn is dominated by reading the prefix, not by writing the answer.
The two workloads stress opposite halves of the engine. Throughput benchmarks measure the half that agents lean on least. Two engines can sit within a few percent of each other on tokens per second and differ by two orders of magnitude on the thing that decides whether a card finishes in ten minutes or does not finish at all.
I know the second case because I had it. On the old stack a medium engineering card ran past forty-five minutes without completing. Generation was healthy at roughly 140 tokens per second. The model was fine. The engine was re-reading the notebook.
SGLang RadixAttention vs vLLM prefix caching vs llama.cpp
Three candidates, three different answers to the same question.
SGLang uses RadixAttention. Cached prefixes live in a radix tree keyed by the token sequence itself. A new request walks the tree, finds the longest branch it shares with something already cached, and resumes from that branch point. Because the structure is a tree rather than a list, it handles the case where several conversations share an opening and then diverge, which is the exact shape of an agent that tries two approaches to the same bug.
vLLM uses Automatic Prefix Caching on top of PagedAttention. The KV cache is stored in fixed-size blocks, and blocks whose contents hash identically are reused across requests. The reuse is real and it is cross-request, but it lands on block boundaries rather than at an arbitrary branch point, so the granularity is coarser.
llama.cpp has no cross-request prefix cache at all. It holds the KV for the conversation currently occupying a slot. Continue that same conversation and it can reuse what it has. Anything else reprocesses from the start.
| SGLang | vLLM | llama.cpp | |
|---|---|---|---|
| Cross-request prefix cache | RadixAttention: tree-keyed KV reuse, resumes at the longest shared branch | Automatic Prefix Caching over PagedAttention: block-level, hash-matched | None. Caches only the conversation currently in its slot |
| Reuse granularity | Branch point in a radix tree | Fixed-size block boundary | Not applicable |
| How I turned it on | On by default | --enable-prefix-caching on the launch line | Not available |
| Reported hit rate on agent traffic (third-party, not mine) | 75 to 95 percent, and about 29 percent ahead of vLLM on multi-turn | Reported good, second to RadixAttention on heavily shared prefixes | Not applicable |
| Tool calling | Constrained decoding, 96 to 98 percent schema compliance reported | Per-model parser via --tool-call-parser | OpenAI-compatible tools, but sequential, no continuous batching |
| On two RTX 5090s (sm_120) | Boots, loads NVFP4 cleanly | 0.22.0 on CUDA 13.2, NVFP4 MoE on real FlashInfer Cutlass kernels, no Marlin fallback | Auto-detects the cards, no build pain |
| What broke for me | GLM AWQ loader: torch.cat on a zero-dimensional tensor in glm4_moe_lite.py | MLA attention crash on quantised MLA, fixed by a one-line patch | Roughly 52 s of prompt reprocessing every turn |
Two things in that table deserve saying out loud rather than leaving in a cell.
The SGLang hit-rate and schema-compliance figures are third-party, from published comparisons rather than from my box. I am repeating them because they are the numbers a reader will find anyway, and because they are why SGLang was my starting favourite. They are not my measurements and I did not reproduce them.
And llama.cpp's last cell understates its problem on my specific setup. The model I was running at the time, Qwen3-Coder-Next, is a hybrid recurrent architecture whose state cannot be checkpointed and restored across requests at all. So those 52 seconds are two failures compounding: an engine with no cross-request prefix cache, running a model that could not have been prefix-cached anyway. Separating those two is a post of its own, and it is the next one in this series.
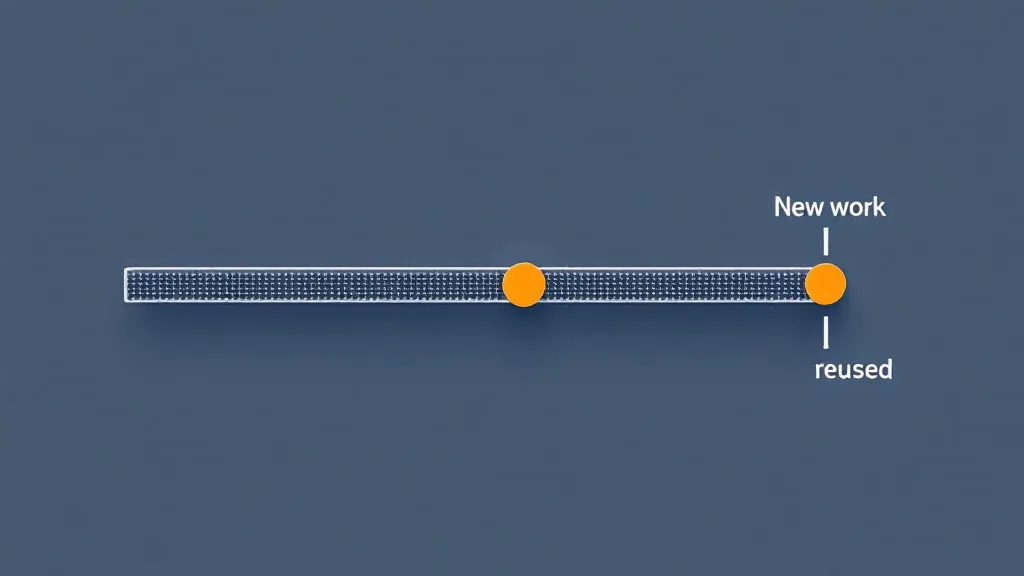
Cross-request prefix caching, measured: 19.7 s cold, 0.10 s warm
| Measured on the box | Value |
|---|---|
| Engine and model | vLLM 0.22.0, GLM-4.7-Flash AWQ, tensor-parallel across both cards |
| Shared prefix | about 30,000 tokens |
| First turn, cold | 19.7 s |
| Every turn after, warm | 0.10 s |
| Ratio | about 190x |
| Prefix cache hit rate, real transcript | about 80% |
| Prefix cache hit rate, byte-identical prefix | 99.8% |
| llama.cpp baseline, every turn, about 162,000 tokens of context | about 52 s |
Read the ratio, not the gap. 19.7 seconds against 0.10 seconds is the same engine, the same model and the same prefix, measured once cold and then warm. That is the number that transfers to your hardware.
The 52 seconds is not a like-for-like comparison and I am not going to pretend it is. It was measured on a different engine running a different model at roughly 162,000 tokens of context, against a 30,000-token prefix on the vLLM side. What makes it worth putting in the same table is not its magnitude but its shape: llama.cpp paid that cost on every single turn, and vLLM paid its cost once.
That shape is the whole argument. An engine that reuses the prefix has a per-turn cost that stays roughly flat however long the conversation grows. An engine that does not has a per-turn cost that grows with the transcript, on a workload whose defining feature is a transcript that grows.
A month later, after an unrelated change to the serving config, a smoke test against a byte-identical prefix reported a 99.8% hit rate. Treat that as the ceiling rather than the working number. About 80% is what a real agent transcript looks like, because a real transcript keeps appending new tokens that nothing has cached yet.

The second axis nobody benchmarks: tool-call reliability
Prefix caching decided which engines stayed in the running. It did not decide between the two that were left, and the criterion that should have is almost never charted.
An agent does not just emit prose. It emits structured tool calls, and something on the server side has to parse the model's output into a function name and an arguments object. That parser is per-model, and it is selected by hand at launch.
Consider what a small failure rate does to a long loop. At a 2% chance of a malformed tool call per turn, a 60-turn card completes cleanly with probability 0.98 to the power of 60, which is about 0.30. Seven runs in ten hit at least one bad call. The same 2% is a rounding error on a chat benchmark and a coin flip on an agent card.
It is also usually silent. A malformed tool call does not raise an exception. It arrives as a well-formed request carrying the wrong arguments, and the agent acts on it.
The vLLM tool call parser gotcha, and two more like it
Three parser-class failures I hit, in the order they cost me time.
A parser name one minor version behind the model card. I was serving GLM-4.7-Flash with --tool-call-parser glm45. The model card specifies glm47. Both parsers are registered in vLLM 0.22.0, so nothing errors, nothing warns, and the server starts and answers normally. The correction changed only the parser flags and left every other launch argument untouched. The smoke gate that proved the difference: under the corrected parser, a zero-argument tool call parses to {}. Under the old one it did not. A tool that takes no arguments is an ordinary shape, not an exotic one, so this was firing on exactly the calls that look least likely to break.
Reasoning tokens leaking into the answer. GLM-4.7-Flash is a thinking model and emits its reasoning wrapped in <think> tags inside the message content. With no --reasoning-parser set, that reasoning sits in the same field the client reads for the answer, and in the worst case for the tool call. Adding the reasoning parser moved it into a separate reasoning_content field, with no leakage into content.
Greedy decoding. The same thinking model at temperature 0 loops indefinitely and never emits a final answer. It needs a non-zero temperature to terminate at all. The exact sampling values are per-model and mine changed once while tuning, so take the shape of the lesson rather than my numbers: a thinking model needs its sampling configured deliberately, and inheriting your client's defaults is not configuring it.
None of those three is a benchmark result. All three are launch flags. And all three would have read as "this model is bad at tool calling" if I had not gone looking.
On this axis SGLang has the better published record. Its constrained decoding is reported at 96 to 98 percent schema compliance, and constrained decoding is a stronger guarantee than parsing, because it prevents malformed output rather than interpreting it after the fact. Third-party numbers again, not mine.
Where each engine actually won, and the boring reasons why
By the end of the caching and tool-calling analysis, SGLang was ahead on design. RadixAttention is the better caching mechanism for this workload. Constrained decoding is the better reliability story. Both engines boot on consumer Blackwell and both load NVFP4 cleanly on sm_120, so none of this was a question of whether the software runs on a 5090.
What decided it was which quantised file would load.
| Quantisation | On this box, vLLM 0.22 and SGLang 0.5.12 |
|---|---|
| NVFP4 (compressed-tensors) | Reliable. Real FlashInfer Cutlass kernels, no fallback. |
| AWQ | Hit or miss. GLM MoE works with the attention patch below. Qwen2.5-Coder-32B AutoAWQ-gemm emits nothing but exclamation marks, on both the Marlin and the classic AWQ kernel. |
| FP8 | Garbage output. The Blackwell fp8_w8a8 MoE kernel is untuned for this card. |
| MXFP4 at the 120B class | Does not fit. About 30.5 GB of weights per card against about 31.4 GB usable, before any KV cache at all. |
Qwen2.5-Coder-32B is one of the most widely used coding models in existence. When it emits exclamation marks, the honest reading is that the format is broken on this hardware, not that the model is bad.
Against that backdrop, here is what happened to the model I actually wanted to serve.
GLM-4.7-Flash AWQ on SGLang: dead on arrival. A loader bug in glm4_moe_lite.py, a torch.cat on a zero-dimensional tensor. Nothing I could work around from the launch line.
GLM-4.7-Flash AWQ on vLLM: also dead on arrival, with AttributeError: 'ColumnParallelLinear' object has no attribute 'weight' raised inside MLA attention. The cause is clear once you read the file. AWQ packs weights into qweight, so .weight does not exist. vLLM 0.22.0's mla_attention.py already knows that: about ten lines above the crash it computes a safe dtype behind a hasattr(self.kv_b_proj, "weight") guard and stores it. Then it ignores what it stored and reads self.kv_b_proj.weight.dtype directly. It is a one-line bug, and the fix is to use the value already sitting there.
That is the entire difference between the two engines on my box. One had a bug I could fix in a single line and apply by bind-mounting the patched file over the container path, with no rebuild and no fork. The other had a bug inside a model-specific loader that I would have had to fix properly and then maintain.
So the workstation runs vLLM. Notice how little that says about vLLM.
The best LLM engine for agents is a decision rule, not a winner
I am not going to tell you vLLM beat SGLang, because that is not what happened. What happened is that on one GPU generation, with one quantisation of one model, in one fortnight, one project's bug was cheaper to route around than the other project's. Change the model and the ranking can invert. It nearly did.
The rule underneath is what transfers.
First, does it reuse a prefix across requests? If not, it is disqualified for agent work regardless of what its throughput chart says, and no amount of tuning recovers it. That eliminates llama.cpp for this workload. It also eliminates model architectures whose state cannot be cached at all, even on an engine that caches well, which is a trap worth its own post.
Second, does its tool-call parser match your model card exactly, and have you proved it? Not "does tool calling work" against a one-shot demo. Prove it on a zero-argument call, on a model that emits reasoning tokens, and across a forced multi-call sequence. Do this before you trust any throughput number, because a 2% parse failure across 60 turns costs you more than a 30% throughput deficit does.
Third, and only third, let quantisation formats and wheel reality on your specific hardware break the tie. Which quant loads, which kernels are tuned for your compute capability, which loader bugs bite. It is unglamorous, it appears in no comparison article, and on my box it was decisive.
Throughput is the tiebreaker after all of that, and I never reached it. The bake-off was settled before tokens per second entered the conversation, which is roughly the reverse of how every engine comparison I read had framed the question.
If you are choosing today, on different hardware, with a different model, run steps one and two yourself and expect step three to hand you a different answer than it handed me. The rule survives the move. The winner does not.